SOFTWARE SOLUTIONS

Astoria-Pacific is committed to providing the customer with the best available software for automated analysis. We work with our customers to make sure that their input leads to even better versions of our software in the future. Currently there are three software packages offered by Astoria-Pacific: NEOPac for the Spotcheck; FASPac2 for the Astoria and Astoria2 analyzers; and rAPID-T for the rAPID-T System.
NEOPac
The latest version of the Spotcheck’s data acquisition software is a dynamic tool to help Newborn Screening labs process thousands of samples per year. Sample IDs are easily entered into a convenient Sample Table. A Run Table provides real time information concerning sample probe location and data retrieval. Channel windows provide a real time “trace” of the baseline and subsequent “peaks” of concentration values of calibrants, samples, check calibrants, wash cups and other values. A QC Chart is incorporated into the software to monitor the performance of the system over time and to alert the operator if maintenance is required. And security levels are available to provide the lab control of what functions of FASPac its personnel will have access to. Sample results can be flagged if they fall within the lab’s cutoff limits, alerting the operator to take appropriate action.
Click HERE for more info about NEOPac.
FASPac2
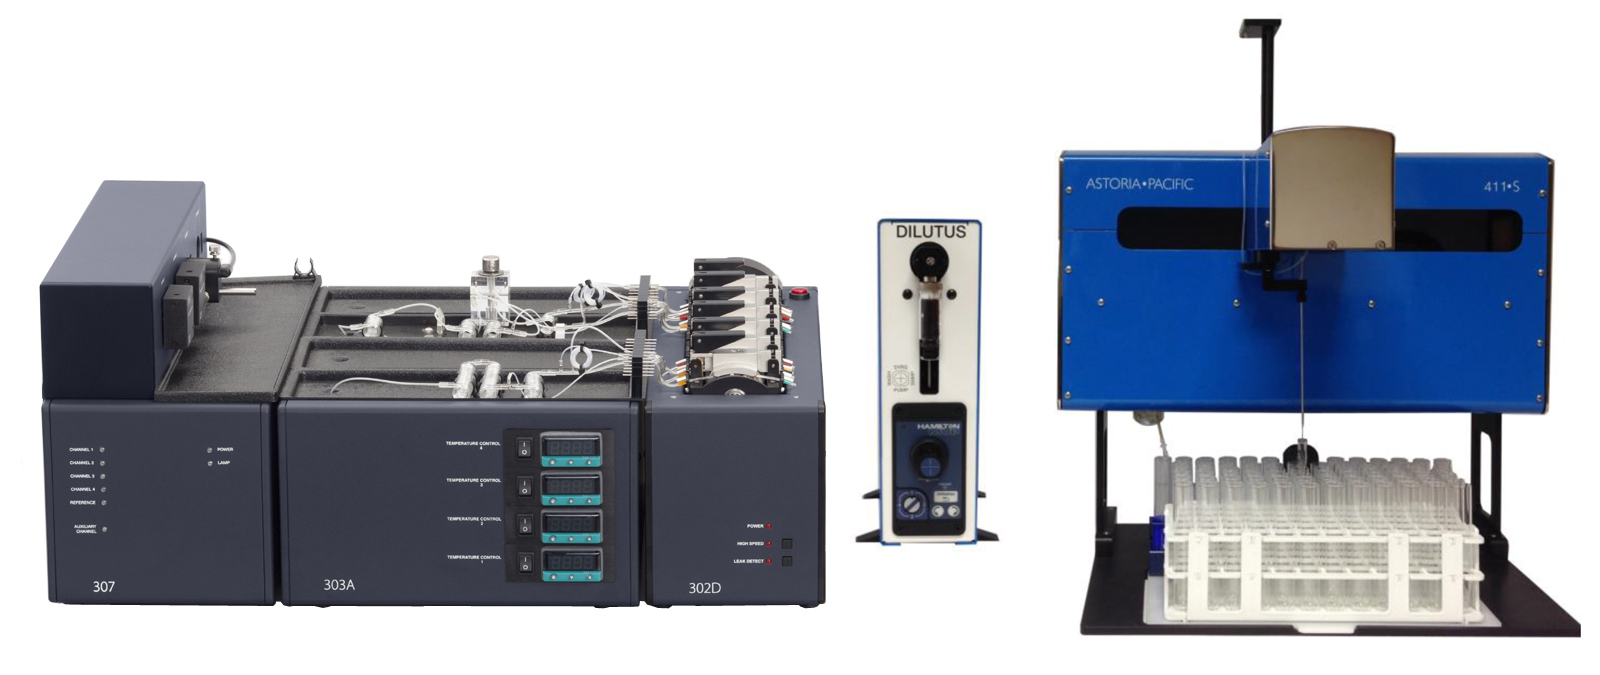
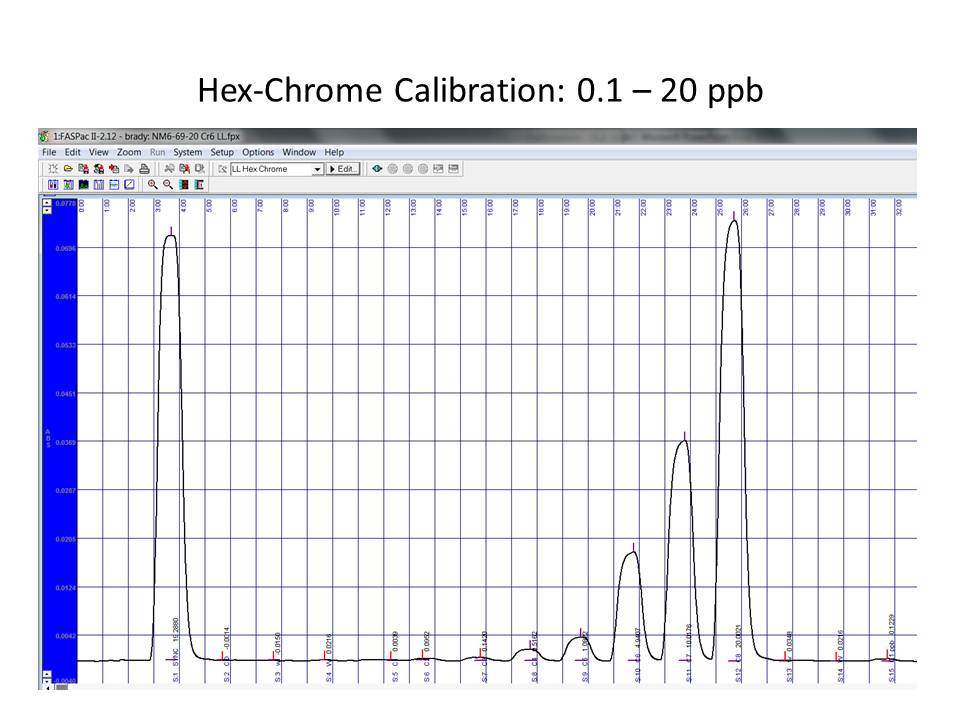
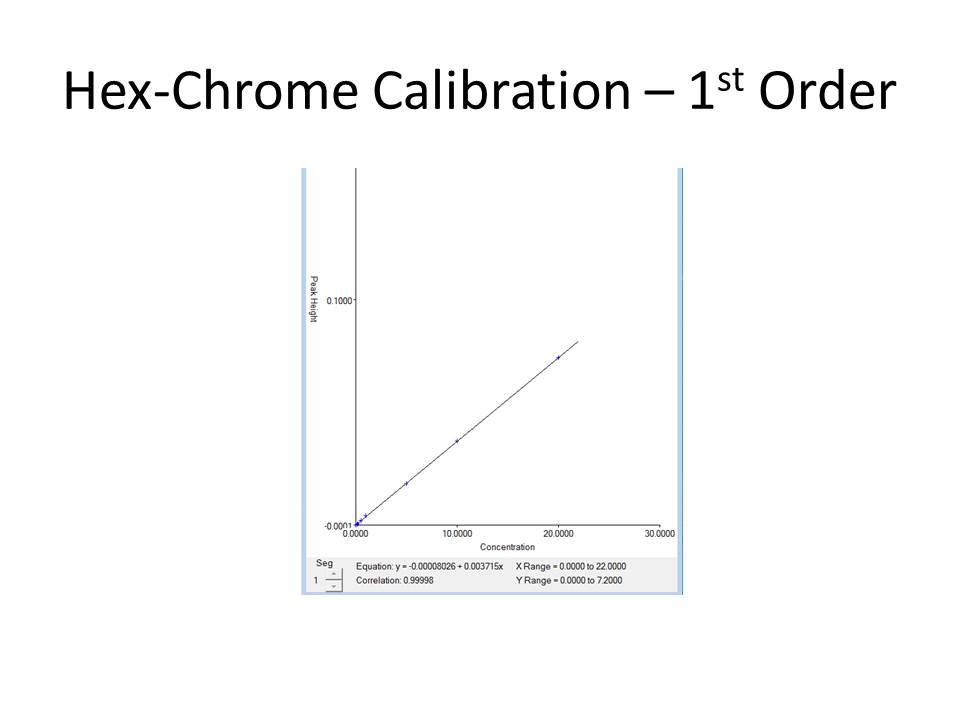
FASPac2 is the latest version of FASPac. This powerful, unique Flow Analyzer Software Package (FASPac) controls, collects and processes data from up to six (6) digital channels and one (1) analog channel simultaneously. Working within the Windows environment, FASPac offers a sophisticated graphical presentation of information and data, easily customized for your needs.
Click HERE for more information about FASPac2
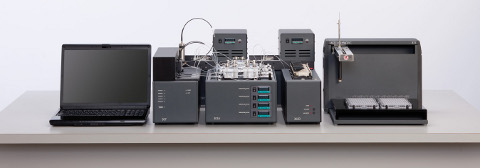
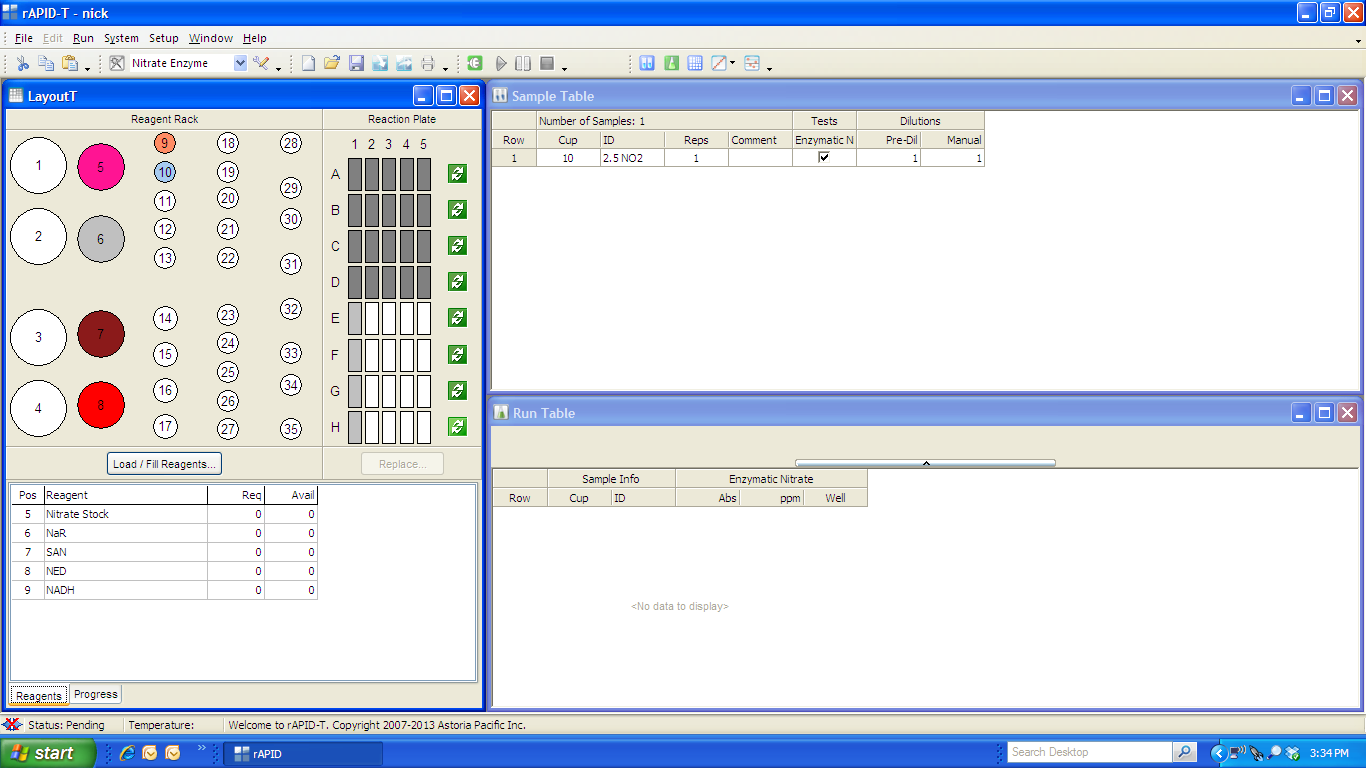
rAPID-T
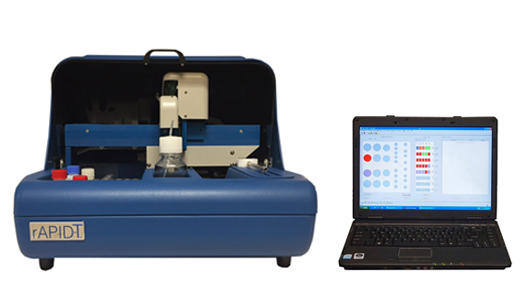
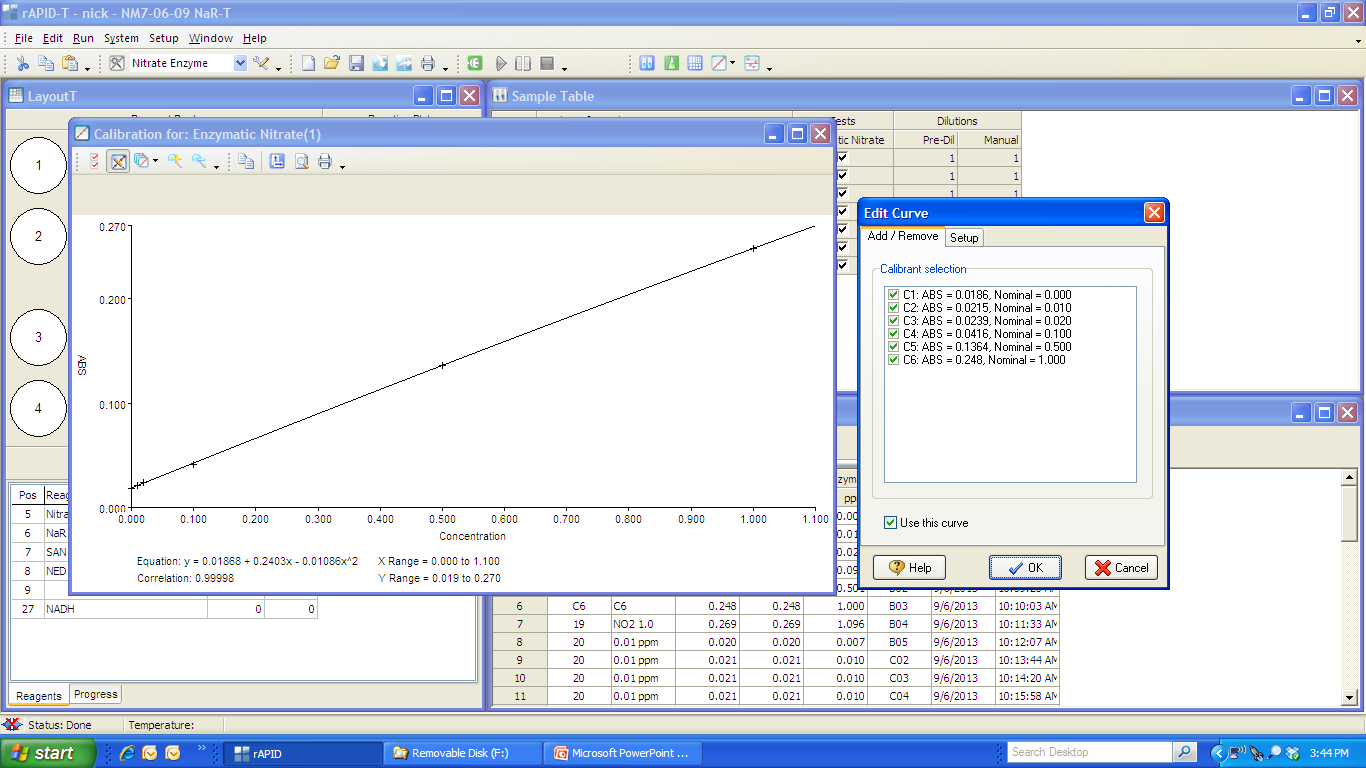
rAPID-T software allows you to quickly analyze your samples. It can automatically dilute samples that than are above range, and/or you can have the system pre-dilute them as needed. Values can be uploaded into the software’s integrated QC database and viewed in user-defined charts. A graphical display of the system provides real-time info such as samples in progress, time left for analysis, sample concentrations already collected, warnings of low reagent, etc.
Click HERE for more info about rAPID-T and rAPID-T System